All content on this site is intended for healthcare professionals only. By acknowledging this message and accessing the information on this website you are confirming that you are a healthcare professional. If you are a patient or carer, please visit the International Myeloma Foundation or HealthTree for Multiple Myeloma.
The Multiple Myeloma Hub website uses a third-party service provided by Google that dynamically translates web content. Translations are machine generated, so may not be an exact or complete translation, and the Multiple Myeloma Hub cannot guarantee the accuracy of translated content. The Multiple Myeloma Hub and its employees will not be liable for any direct, indirect, or consequential damages (even if foreseeable) resulting from use of the Google Translate feature. For further support with Google Translate, visit Google Translate Help.


The Multiple Myeloma Hub is an independent medical education platform, sponsored by Bristol Myers Squibb, GSK, Johnson & Johnson Innovative Medicine, Legend Biotech, Pfizer, Roche, and Caribou Biosciences. Funders are allowed no direct influence on our content. The levels of sponsorship listed are reflective of the amount of funding given. View funders.
Now you can support HCPs in making informed decisions for their patients
Your contribution helps us continuously deliver expertly curated content to HCPs worldwide. You will also have the opportunity to make a content suggestion for consideration and receive updates on the impact contributions are making to our content.
Find out more
Create an account to access:
Bookmark & personalize site content
Receive alerts for new content in your areas of interest
View multiple myeloma content recommended for you
Current perspectives on circulating tumor cells in newly diagnosed MM eligible for transplant
Do you know... What level has been identified as a cut-off for CTCs that indicates higher risk MM in newly diagnosed patients?
Introduction
Obtaining peripheral blood (PB) samples from patients for the assessment of circulating tumor plasma cells (CTPC) is a far less less-invasive technique than bone marrow (BM) biopsy or aspiration. However, CTC assessment still enables real-time estimation of tumor burden and genetic alterations in multiple myeloma (MM) cells and clonal lines. Precise assessment of CTCs can lead to an appropriate risk evaluation and improved disease management.
The MM Hub has previously published an article on the potential role of CTCs in the prognosis and management of MM, and reported on the utility of CTCs in the identification of high-risk MM patients.
Here, we present promising data around the measurement of CTCs in the investigation and management of newly diagnosed (ND) MM from recently published articles in Journal of Clinical Oncology by Garcés, et al.,1 Bertamini, et al.,2 and Chakraborty and Lentzsch.3
The role of CTC in staging patients with NDMM who are eligible for transplant1
Study design
This study measured CTCs in the PB of 374 patients from the GEM2012MENOS65 (NCT01916252) and GEM2014MAIN (NCT02406144) trials. Next-generation flow cytometry was used to evaluate CTCs in PB at diagnosis and measurable residual disease (MRD) in BM throughout treatment. Patients who had no MRD assessment after consolidation were entered as MRD-positive if complete remission (CR) was not achieved and MRD-missing if in CR.
Subgroup analysis was performed according to CTC ranges, including 0.0001% to <0.001%, ≥0.001% to <0.01%, ≥0.01% to <0.1%, >0.1% to <1%, and ≥0.1%. Baseline features (age, International Staging System [ISS] stage, lactate dehydrogenase [LDH], cytogenetic abnormalities (CA), Revised-ISS (R-ISS) stage, plasmacytoma, and BM plasma cells [BM PCs]) and MRD response were also compared.
Results
- CTCs were detected in 92% of patients with NDMM, with a median of 0.017% CTCs.
- A modest correlation was found between CTCs and PCs in BM, as determined by morphology (correlation [ρ] = 0.41; probability p < 0.001) and flow cytometry (ρ = 0.46; p < 0.001 ).
- Increasing logarithmic percentages of CTCs were associated with inferior progression-free survival (PFS) (Table 1).
Table 1. Multivariable analysis of PFS and OS including the percentages of BM PCs*
|
BM, bone marrow; CI, confidence interval; CTC, circulating tumor cell; HR, hazard ratio; OS, overall survival; PC, plasma cell; PFS, progression-free survival. |
||||
|
Biomarker, % |
PFS |
OS |
||
|---|---|---|---|---|
|
HR (95% CI) |
p value |
HR (95% CI) |
p value |
|
|
BM PCs |
1.0 (1–1.0) |
0.13 |
1.01 (1–1.0) |
0.20 |
|
BM clonal PCs |
1.0 (1–1.0) |
0.23 |
0.99 (0.97–1.0) |
0.47 |
|
CTC |
1.1 (1.0–1.2) |
0.01 |
1.14 (1.01–1.3) |
0.03 |
- Patients with ISS III and II had significantly increased CTC levels compared with ISS I.
- CTC levels were increased in patients with elevated versus normal LDH levels or with high-risk versus standard-risk CA.
- High CTC levels were associated with an increased risk of relapse.
- Patients with undetectable CTCs had exceptional PFS regardless of CR and MRD status.
- Multivariable PFS analysis including ISS stage, LDH levels, and cytogenetics showed that the patients with ≥0.01% CTCs had inferior PFS.
- In all other subgroups, achieving undetectable MRD was significantly associated with a longer PFS (p ≤ 0.045).
PFS in patients grouped according to number of risk factors is summarized in Table 2.
Table 2. PFS and 5-year OS in patients according to the presence of risk factors from a proposed novel classification system for patients with NDMM*
|
NR, not reached; OS, overall survival; PFS, progression free survival. |
|||
|
Outcome
|
Risk factors† |
||
|---|---|---|---|
|
0 |
1–2 |
≥3 |
|
|
PFS, months |
NR |
73 |
32 |
|
5-year OS, % |
88 |
85 |
57 |
Overall, the incorporation of CTC serum levels into the PB at diagnosis promises to enhance the sensitivity of current stratifying systems. CTC levels ≥0.01% improved the performance of current risk models incorporating ISS, LDH, and CA for transplant-eligible patients with NDMM. However, further research is needed to build on existing knowledge in this area through the validation and replication of these findings in large, prospective clinical MM trials.
The role of CTC in identifying aggressive disease in ASCT-eligible patients with NDMM2
Study design
This study performed CTC analysis on 401 patients recruited to the multicenter FORTE trial (NCT02203643), which has previously been discussed on the Multiple Myeloma Hub. CTC and MRD was assessed by second-generation multiparameter flow cytometry (sensitivity, 4 × 10⁻⁵ and 10-5, respectively) to predict PFS and OS in patients with NDMM, in the presence of other high-risk factors and MRD.
Hazard regression analysis was performed using three models:
- ISS + CA + LDH or R-ISS (described as null model)
- Null model with CTC
- CTC alone
Results
- CTCs were detected in 67% of the patients at diagnosis.
- CTC levels were moderately correlated with BM PCs (r = 0.382; p < 0.01).
- The median follow-up was 50 months.
- A cut-off of 0.07% CTCs was selected as the level providing the highest prognostic value for the prediction of PFS and OS.
- Two populations were identified based on the CTC cut-off: CTC-high (>0.07%) and CTC-low (≤0.07%).
- Over 50% of the CTC-low population (n = 132) had undetectable CTC.
- Adverse prognostic factors were more prevalent in CTC-high patients (Table 3).
Table 3. Prevalence of adverse prognostic features in CTC-high versus CTC-low patients*
|
CR, complete response; CTC, circulating tumor cells; MRD, minimal residual disease. |
|||
|
Feature/response, % |
CTC-high |
CTC-low |
p value |
|---|---|---|---|
|
Total |
68 |
32 |
|
|
International Staging System |
|
|
<0.001 |
|
I |
61 |
29 |
|
|
II |
27 |
40 |
|
|
III |
13 |
31 |
|
|
Cytogenetic abnormalities |
|
|
<0.001 |
|
Low risk |
74 |
53 |
|
|
High risk |
26 |
47 |
|
|
High lactate dehydrogenase |
8 |
25 |
<0.001 |
|
Revised International Staging System |
|
|
|
|
I |
40 |
12 |
|
|
II |
55 |
60 |
|
|
III |
5 |
19 |
|
|
MRD negativity at consolidation |
59 |
42 |
0.001 |
|
Premaintenance ≥CR |
54 |
43 |
0.055 |
PFS and OS were significantly lower in CTC-high patients compared with CTC-low or CTC-undetectable patients (Figure 1), with no difference observed between CTC-undetectable and CTC-low patients. Both PFS (hazard ratio [HR], 2.61; 95% confidence interval [CI], 1.49–2.97, p < 0.001) and OS (HR, 2.16; 95% CI, 1.49–4.56) were reduced in CTC-high patients relative to those with low CTC (Figure 1).
Figure 1. 4-year PFS and 4 year-OS in CTC-high versus CTC-low patients*
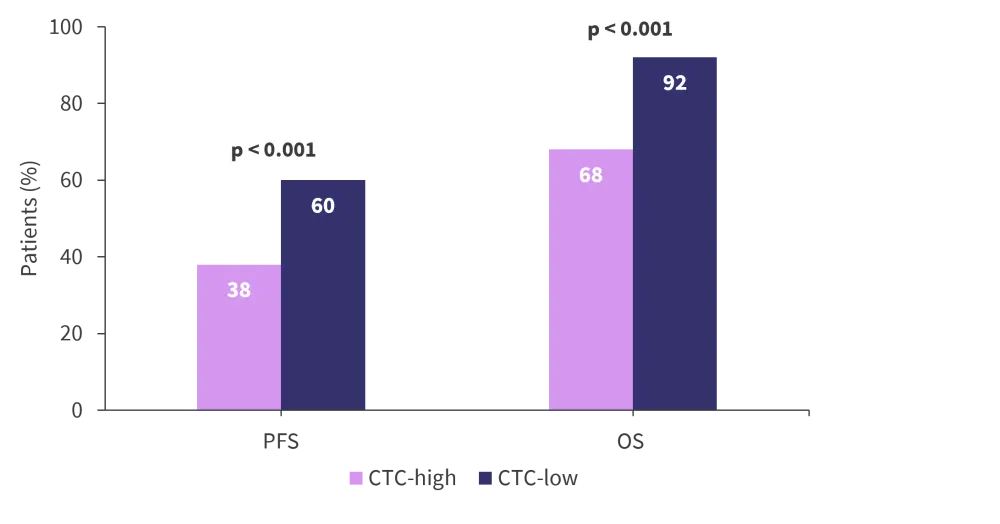
OS, overall survival; PFS, progression free survival.
*Adapted from Bertamini, et al.2
MRD negativity after induction nullified the inferior influence of CTC-high in this patient group (interaction P = 0.039). In patients with any level of CTC, negative MRD was significantly associated with an increase in PFS (p ≤ 0.045).
Overall, high levels of CTC (≥0.07%) robustly identifies a high-risk population and MRD negativity is the most important factor in removing the negative prognostic influence of high CTC.
Are we ready to incorporate CTC assessment into routine clinical evaluation and treatment of patients with MM?3
Two cut-off values of CTC (≥0.01% and ≥0.07%) were identified as a prognostic factor in NDMM, using three groups of randomized controlled trial data (Table 4). Despite different cut-off values in each trial, there was consistent evidence that CTC burden is a strong, negative, and independent prognostic factor for transplant-eligible patients with NDMM. Thus, CTC assessments using next-generation flow cytometry at baseline could be used for risk stratification in this population.
Table 4. Characteristics of studies assessing CTCs in patients with NDMM*
|
BM PC, bone marrow plasma cells; CTC, circulating tumor cell; MFC, multiparameter flow cytometry; ND, newly diagnosed; MM, multiple myeloma; n/a, not applicable; NGF, next-generation flow cytometry; PCL, plasma cell leukemia. |
|||
|
Characteristic |
GEM2012MENOS65 |
FORTE |
EMN12/HO129, |
|---|---|---|---|
|
Median follow-up, years |
5 |
4.2 |
4.8 in the pooled survival cohort† |
|
Methodology used for |
MFC |
MFC |
MFC |
|
Sensitivity (limit of |
2 × 10⁻⁶ (NGF) |
4 × 10⁻⁵ |
2 × 10⁻⁶ (NGF) |
|
ND patients with CTC, |
92 |
67 |
87 |
|
Correlation between |
ρ = 0.41‡ (p < 0.001) |
ρ = 0.382‡ (p < 0.1) |
Adjusted R2 = 0.16§ (p < 0.001) |
|
CTC cut off for risk |
≥0.01 |
≥0.07 |
n/a |
Unmet needs for future MM studies on CTC burden
- It is necessary to use high CTC burden as an inclusion criterion for study participants in the absence of clinical plasma cell leukemia but with >5% CTC on morphology at first diagnosis.
- At diagnosis, almost all MM cells express CD38. The effects of anti-CD38 monoclonal antibody-based regimens on the outcomes of patients who are CTC-high at baseline needs investigating.
- To determine the impact of novel immunotherapies such as T-cell engagers and chimeric antigen receptor T-cell therapies in CTC-high MM.
- To determine the utility of CTC for the prognostication of PCL-like disease
Conclusion
High levels of CTCs, above an optimal cut-off (≥0.01%), represent a robust and independent high-risk factor in patients with NDMM. CTC-burden evaluation can increase the sensitivity of existing risk-stratification criteria and holds potential for the identification of high-risk disease and risk-adapted treatment approaches. However, before incorporation of high CTC burden into routine clinical practice, further research is needed in transplant-eligible and transplant-ineligible patients receiving similar therapeutic regimens.
References
Please indicate your level of agreement with the following statements:
The content was clear and easy to understand
The content addressed the learning objectives
The content was relevant to my practice
I will change my clinical practice as a result of this content