All content on this site is intended for healthcare professionals only. By acknowledging this message and accessing the information on this website you are confirming that you are a healthcare professional. If you are a patient or carer, please visit the International Myeloma Foundation or HealthTree for Multiple Myeloma.
The Multiple Myeloma Hub website uses a third-party service provided by Google that dynamically translates web content. Translations are machine generated, so may not be an exact or complete translation, and the Multiple Myeloma Hub cannot guarantee the accuracy of translated content. The Multiple Myeloma Hub and its employees will not be liable for any direct, indirect, or consequential damages (even if foreseeable) resulting from use of the Google Translate feature. For further support with Google Translate, visit Google Translate Help.


The Multiple Myeloma Hub is an independent medical education platform, sponsored by Bristol Myers Squibb, GSK, Johnson & Johnson Innovative Medicine, Legend Biotech, Pfizer, Roche, and Caribou Biosciences. Funders are allowed no direct influence on our content. The levels of sponsorship listed are reflective of the amount of funding given. View funders.
Now you can support HCPs in making informed decisions for their patients
Your contribution helps us continuously deliver expertly curated content to HCPs worldwide. You will also have the opportunity to make a content suggestion for consideration and receive updates on the impact contributions are making to our content.
Find out more
Create an account to access:
Bookmark & personalize site content
Receive alerts for new content in your areas of interest
View multiple myeloma content recommended for you
The IMWG 2/20/20 risk stratification model for smoldering multiple myeloma
Smoldering multiple myeloma (SMM) is an asymptomatic precursor state of multiple myeloma, representing a transitional stage between monoclonal gammopathy of undetermined significance (MGUS) and active multiple myeloma (MM).1 SMM is a heterogeneous disease with a 10% risk of progression during the first 5 years after diagnosis, 3% between 5 and 10 years after diagnosis, and 1% after 10 years after diagnosis. For this reason, treatment for SMM is close monitoring in the first instance.1 However, in 2013, Mateos et al. demonstrated that a small subset of patients diagnosed with SMM could benefit from active treatment with lenalidomide plus dexamethasone, with increased overall survival and delayed progression to MM.2 This ultra-high-risk subgroup of patients with SMM presented an approximately 80% chance of progression at 2 years following diagnosis, and after revision by the International Myeloma Working Group (IMWG), these patients were recategorized as MM.
The subsequent IMWG defining criteria for MM expanded beyond the standard CRAB features and included:3
- Bone marrow precursors cells (BMPC) ≥ 60%
- Involved/uninvolved serum free light-chain ratio (FLCr) ≥ 100
- Presence of > 1 focal lesion on magnetic resonance imaging in patients having bone marrow with at least 10% of clonal BMPC infiltration
As a result of the established new criteria for MM, there was a need to redefine SMM risk classification. For that purpose, María-Victoria Mateos and colleagues undertook a large, retrospective cohort study to identify factors predicting patients at high risk of progression to MM at 2 years. Here, we present their work published recently in the Blood Cancer Journal and the resulting risk score to guide treatment decisions for patients with SMM.1
Study design
In this multicenter, retrospective, international study, they collected the data from patients:
- diagnosed after January 2004 in IMWG centers
- with active SMM according to 2014 IMWG criteria
- who did not progress to MM or other plasma cell disorder within 6 months of SMM diagnosis
- who had available follow-up data of a minimum of 1 year
- who did not have participated in an interventional clinical trial
Study endpoints
The primary objective was to establish the time to progression (TTP) or amyloidosis, defined as the time between diagnosis of SMM and progression.
The secondary objective was to develop a risk scoring tool to define the individual risk of a patient with SMM progressing to MM at various time points after diagnosis.
Data collection
Baseline, diagnostic, and 12-month data were collected using study-specific case report forms. Baseline characteristics included:
- Demographic data – age, sex
- Serum markers – hemoglobin, creatinine, calcium, albumin, beta-2-microglobulin, serum M-protein (SMP), FLCr, heavy chain type/subtypes, light chain type
- Urine markers – M-spike
- MM treatment and investigation data – immunoparesis and BMPC (highest valued out of biopsy vs aspirate)
Statistical analysis
Univariate analysis was used to assess initial relationships between patient-specific factors and progression. The receiver operating characteristic (ROC) curves were generated for the factors with a p value of significance ≤ 0.025, and the sensitivity and specificity reported to identify optimal cutoff points. A risk score was developed to determine the strength of the combined individual factors at predicting relapse.
Results
A total of 1996 patients were recruited from 75 centers in 23 countries:
- Median follow-up from diagnosis was 3 years (interquartile range [IQR], 1.6–5.1 years)
- 41% of patients had progressed to MM (or related) from SMM by the data cutoff
- Median TTP was 6.4 years (95% CI, 6.0–7.2)
- Overall:
- 2-year risk of progression 22%
- 5-year risk of progression 42%
- 10-year risk of progression 64%
- The 5-year overall survival was estimated at 93.8% (95% CI, 92.0–95.2)
- The 10-year estimated overall survival was 88.3% (95% CI, 84.8–91.1)
Risk factors for progression to MM at 2 years
The SMP, FLCr, and BMPC were identified as the most relevant factors for predicting SMM progression to MM, with cutoffs at 2 g/dL, 20, and 20%, respectively (Table 1). The three-risk factors are considered together for the 2/20/20 risk stratification and can be complemented by detecting the most relevant chromosomal abnormalities for the four-risk factor stratification (Figure 1).
Table 1. Core characteristics of risk factor identification and stratification analysis, and selection of cutoff values for identified factors.1
|
BMPC, bone marrow precursors cells; FLCr, involved/uninvolved serum free light-chain ratio; HR, hazard ratio; IQR, interquartile range; N, number; N/A, not applicable; SMP, serum M-protein. |
||||
|
Characteristic |
SMP |
FLCr |
BMPC |
Chromosomal abnormalities |
|---|---|---|---|---|
|
N |
1996 |
1636 |
1996 |
689 |
|
Median (IQR) |
1.8 g/dL (1.1–2.6) |
6.2 (2.1–24.1) |
15% (IQR 12–25) |
N/A |
|
Chromosomal abnormalities |
N/A |
N/A |
N/A |
Trisomy, 31.4% |
|
Candidate risk factor p value (p ≤ 0.025) |
< 0.0001 |
< 0.00001 |
< 0.00001 |
N/A |
|
HR (CI 95%) |
1.09 (1.06–1.12) |
1.1 (1.06–1.13) |
1.44 (1.36–1.52) |
N/A |
|
Cutoff value |
1.91 g/dL |
19.3 |
16.40% |
N/A |
|
Specificity (%) |
60 |
78.7 |
58.1 |
N/A |
|
Sensitivity (%) |
70.6 |
54.7 |
71.8 |
N/A |
|
Cutoff levels chosen for risk stratification |
2 g/dL |
20 |
20% |
N/A |
Figure 1. The IMWG 2/20/20 risk stratification model.1
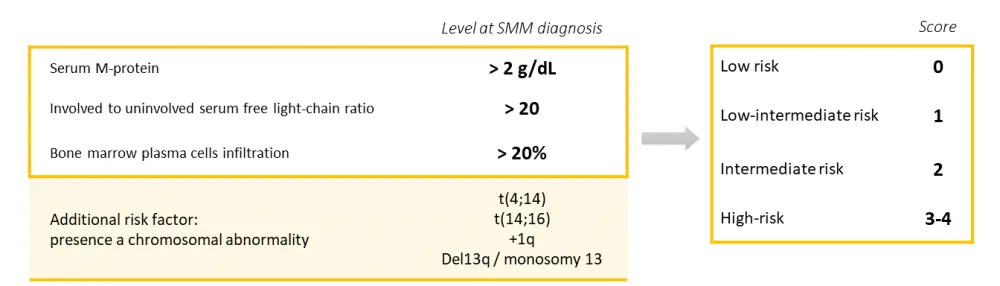
Risk classifications (low, low-intermediate, intermediate, high) were allocated according to the number of risk factors present, and the hazard ratio and risk of progression at 2 years (%) were calculated for each scenario (Table 2).
Table 2. Probability of progression from SMM to MM at 2 years according to described risk factors from IMWG 2/20/20 with three- and four-risk factor model.1
|
IMWG, International Myeloma Working Group; MM, multiple myeloma; SMM, smoldering multiple myeloma. |
||||
|
Risk
|
Number of risk factors |
Hazard ratio (95% CI) |
Risk of progression at 2 years, % |
N (%) |
|---|---|---|---|---|
|
3-risk factor model (2/20/20) |
||||
|
Low-risk |
0 |
Reference |
6.2 |
522 (38.3) |
|
Intermediate-risk |
1 |
2.99 (1.97–4.54) |
17.9 |
445 (32.7) |
|
High-risk |
2–3 |
9.02 (6.15–13.2) |
44.2 |
396 (29.1) |
|
|
4-risk factor model |
|||
|
Low-risk |
0 |
Reference |
6.0 |
225 (32.7) |
|
Low-intermediate |
1 |
4.16 (2.26–7.67) |
22.8 |
224 (32.5) |
|
Intermediate-risk |
2 |
9.82 (5.46–17.7) |
45.5 |
177 (25.7) |
|
High-risk |
3–4 |
15.5 (8.23–29.0) |
63.1 |
63 (9.1) |
High-precision risk score
A more comprehensive risk score, including different values of SMP, FLCr, and BMCP, was calculated through a logistic regression model, with a further score for the presence of cytogenetic abnormalities detected by fluorescence in situ hybridization (FISH). Risk groups (low, low-intermediate, intermediate, and high) were allocated according to the total calculation for the patients, and the hazard ratio and risk of progression at 2 years (%) were defined for each subgroup (Table 3).
Table 3. Logistic regression and risk score, predicting progression risk at 2 years.1
|
BMPC, bone marrow precursors cells; FLCr, involved/uninvolved serum free light-chain ratio; HR, hazard ratio; N, number; OR, odds ratio; SMP, serum M-protein. |
||||
|
Risk score criteria |
||||
|---|---|---|---|---|
|
Risk factor |
Coefficient |
OR (95% CI) |
p value |
Score |
|
FLCr |
||||
|
0–10 (reference) |
— |
— |
— |
0 |
|
> 10–25 |
0.69 |
1.99 (1.15, 3.45) |
0.014 |
2 |
|
> 25–40 |
0.96 |
2.61 (1.36, 4.99) |
0.004 |
3 |
|
> 40 |
1.56 |
4.73 (2.88, 7.77) |
< 0.0001 |
5 |
|
SMP (g/dL) |
||||
|
0–1.5 (Reference) |
— |
— |
— |
0 |
|
> 1.5–3 |
0.95 |
2.59 (1.56, 4.31) |
0.0002 |
3 |
|
> 3 |
1.3 |
3.65 (2.02, 6.61) |
< 0.0001 |
4 |
|
BMPC (%) |
||||
|
0–15 (Reference) |
— |
— |
— |
0 |
|
> 15–20 |
0.57 |
1.77 (1.03, 3.06) |
0.04 |
2 |
|
> 20–30 |
1.01 |
2.74 (1.6, 4.68) |
0.0002 |
3 |
|
> 30–40 |
1.57 |
4.82 (2.5, 9.28) |
< 0.0001 |
5 |
|
> 40 |
2 |
7.42 (3.23, 17.02) |
< 0.0001 |
6 |
|
FISH abnormality |
0.83 |
2.28 (1.53, 3.42) |
< 0.0001 |
2 |
|
Risk of progression to MM at 2 years according to overall risk score |
||||
|
|
Total risk score |
HR (95% CI) |
Risk of progression at 2 years, % |
N (%) |
|
Low-risk |
0–4 |
Reference |
3.8 |
241 (35.0) |
|
Low-intermediate |
5–8 |
7.56 (3.77–15.2) |
26.2 |
264 (38.3) |
|
Intermediate -risk |
9–12 |
17.3 (8.63–34.8) |
51.1 |
133 (19.3) |
|
High-risk |
> 12 |
31.9 (15.4–66.3) |
72.5 |
51 (7.4) |
Conclusion
This study establishes that the 2/20/20 risk stratification model can be used, with or without the chromosomal analysis, to identify a subgroup of SMM patients with a greater than 50% probability of progressing to MM within 2 years from diagnosis. This tool is achievable and can be performed with routine tests. It is widely reproducible and useful for SMM clinical trials designed to evaluate the need for earlier treatment in a less heterogeneous group of patients.
The study is limited in that it is retrospective, with some large data exclusions for some variables where it could not be collected, and specific demographics such as race/ethnicity excluded. The study’s extensive, multicenter nature means that there might be variance in laboratory techniques, especially in procedures such as chromosomal analysis. The study also describes that it relies on clinical features and does not consider genetic mutations to influence the progression risk independently.
Identifying patients at a lower or an increased risk of progression from SMM to MM at diagnosis will inform treatment decisions and clinical trial designs. The scoring system described in this paper will facilitate a more individualized patient risk assessment.
References
Please indicate your level of agreement with the following statements:
The content was clear and easy to understand
The content addressed the learning objectives
The content was relevant to my practice
I will change my clinical practice as a result of this content