All content on this site is intended for healthcare professionals only. By acknowledging this message and accessing the information on this website you are confirming that you are a healthcare professional. If you are a patient or carer, please visit the International Myeloma Foundation or HealthTree for Multiple Myeloma.
The Multiple Myeloma Hub website uses a third-party service provided by Google that dynamically translates web content. Translations are machine generated, so may not be an exact or complete translation, and the Multiple Myeloma Hub cannot guarantee the accuracy of translated content. The Multiple Myeloma Hub and its employees will not be liable for any direct, indirect, or consequential damages (even if foreseeable) resulting from use of the Google Translate feature. For further support with Google Translate, visit Google Translate Help.


The Multiple Myeloma Hub is an independent medical education platform, sponsored by Abbvie, Roche, Bristol Myers Squibb, Pfizer, GSK, Johnson & Johnson, Legend Biotech and Caribou Biosciences. Funders are allowed no direct influence on our content. The levels of sponsorship listed are reflective of the amount of funding given. View funders.
Now you can support HCPs in making informed decisions for their patients
Your contribution helps us continuously deliver expertly curated content to HCPs worldwide. You will also have the opportunity to make a content suggestion for consideration and receive updates on the impact contributions are making to our content.
Find out more
Create an account to access:
Bookmark & personalize site content
Receive alerts for new content in your areas of interest
View multiple myeloma content recommended for you
A real-world analysis on the importance of treating MM with best available therapy in earlier lines
Multiple myeloma (MM) remains an incurable hematological malignancy with an estimated 5-year survival rate of 52%. Most patients, 64–95%, receive frontline therapy, however many patients experience disease relapses that require subsequent lines of treatment (LOT). Despite this, rates of attrition and toxicities increase with successive LOT, while depth of response, time to progression, duration of treatment, and patient-reported quality-of-life decrease. These effects strongly support the use of the most effective therapy in the first-line setting.1
As new therapeutic agents have become available, Rafael Fonseca and colleagues evaluated attrition rates by the number of subsequent LOT in a real-world setting using data across 3 US databases, from patients with newly diagnosed MM that did or did not receive autologous hematopoietic stem cell transplantation (auto-HSCT). The results were recently published in the journal BMC Cancer and are summarized below.1
Study design and patient characteristics1
- Retrospective analysis of 24,825 patients with newly diagnosed MM from three databases:
- OPTUM™ Commercial Claims database from January 2000 to September 2018
- OPTUM™ Electronic Medical Records database from January 2000 to September 2018
- Surveillance, Epidemiology, and End Results (SEER)-Medicare Linked database from January 2007 to December 2016
- 22,062 patients did not receive auto-HSCT, 2763 received auto-HSCT
- A LOT was defined as administration of ≥ 1 anti-myeloma agent until discontinuation for ≥ 60 days or until a new agent was administered
- Attrition rate was defined as the ratio of patients that did not have a subsequent LOT because of death or loss to follow-up
- Patient characteristics are shown in Table 1
- The median age was higher in the non-transplanted patients compared with transplanted patients (72 vs 65 years)
- Non-transplanted patients also had a higher Charlson Comorbidity Index score (1.5 vs 1.2)
- A larger proportion of non-transplanted patients had comorbidities compared with transplanted patients (65.9% vs 59.3%), with simple hypertension being the most common in both groups
Table 1. Baseline patient characteristics1
|
LOT, line of therapy. |
||||||||
|
|
Non-transplant |
Transplant |
||||||
|---|---|---|---|---|---|---|---|---|
|
Characteristic |
Overall |
> 1 LOT |
1 LOT |
p value |
Overall |
> 1 LOT |
1 LOT |
p value |
|
Age at diagnosis, y |
||||||||
|
Mean (range) |
71.1 |
70.4 (23–95) |
71.6 |
< 0.0001 |
62.3 |
62.3 |
62.4 |
0.6397 |
|
Median |
72.0 |
72.0 |
73.0 |
< 0.0001 |
65.0 |
64.0 |
65.0 |
0.3294 |
|
Charlson Comorbidity Index, mean (range) |
1.5 |
1.4 |
1.5 |
0.0065 |
1.2 |
1.1 |
1.3 |
0.0306 |
|
Comorbidities prior to starting first LOT*, % |
||||||||
|
Overall |
65.9 |
64.9 |
66.7 |
0.0042 |
59.3 |
57.7 |
65.1 |
0.0013 |
|
Cardiac arrhythmia |
19.6 |
17.1 |
21.5 |
< 0.0001 |
10.6 |
10.6 |
10.7 |
0.9528 |
|
Congestive heart failure |
13.5 |
10.6 |
15.7 |
< 0.0001 |
4.2 |
4.3 |
3.8 |
0.5589 |
|
Hypertension, complicated |
16.9 |
14.5 |
18.6 |
< 0.0001 |
9.4 |
8.1 |
14.3 |
< 0.0001 |
|
Hypertension, simple |
53.0 |
53.2 |
52.9 |
0.6022 |
47.6 |
46.5 |
51.8 |
0.0234 |
|
Hepatic disease |
4.4 |
4.1 |
4.7 |
0.0415 |
5.5 |
4.7 |
8.5 |
0.0004 |
|
Pulmonary circulation disorders |
4.7 |
3.7 |
5.4 |
< 0.0001 |
2.0 |
1.8 |
2.9 |
0.0807 |
|
Renal impairment |
24.1 |
21.9 |
25.8 |
< 0.0001 |
17.0 |
16.1 |
20.6 |
0.0116 |
|
Valvular disease |
10.2 |
9.3 |
10.9 |
0.0001 |
5.7 |
5.4 |
6.7 |
0.2357 |
Results1
- Logistic regression analysis of the overall population showed:
- Non-transplant patients who were older, or had cardiovascular disorders, pulmonary circulation disorders, or renal impairment, were less likely to receive further LOT
- For transplant-eligible patients, liver disease was associated with higher attrition rates, while younger age (< 65 years) was a predictor of subsequent treatment only at 12+ or 24+ months follow-up (OR, 1.30; 95% CI, 1.03–1.65, p = 0.0288 and OR, 1.40; 95% CI, 1.02–1.91; p = 0.0380, respectively).
- Frontline treatment regiments varied for transplanted and non-transplanted patients (Figure 1)
- The most common treatments for non-transplanted patients were bortezomib + dexamethasone (20%) and lenalidomide + dexamethasone (19%)
- For transplanted patients, the most common treatments were bortezomib + lenalidomide + dexamethasone (33%) and other bortezomib-containing regimens (29%)
Figure 1. Frontline treatment regimens1
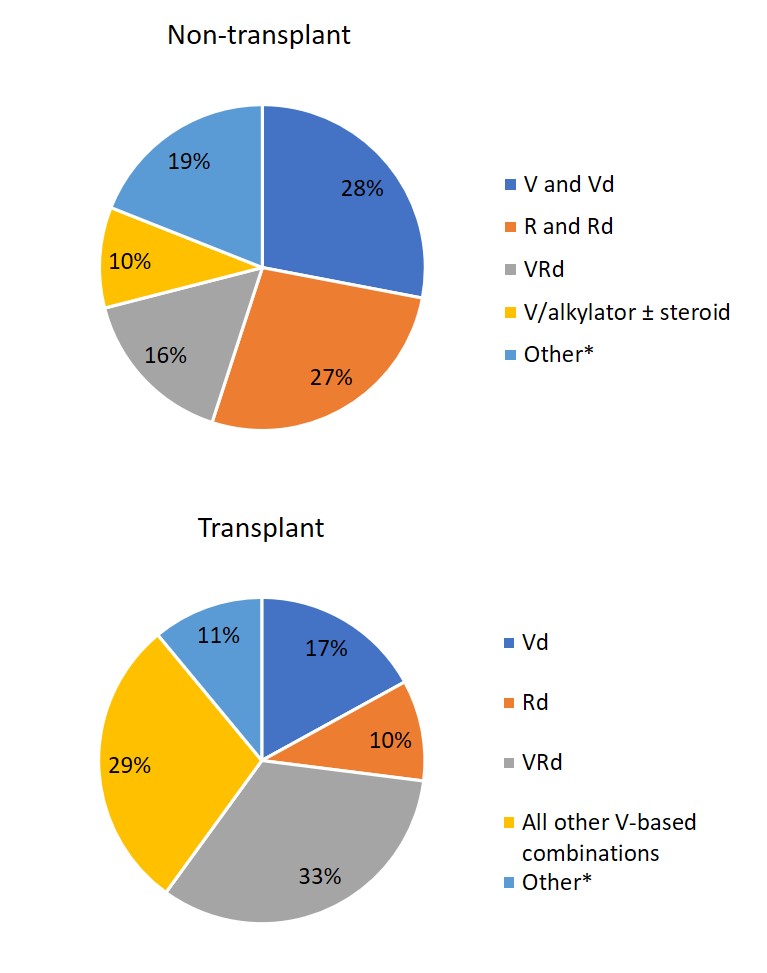
*Other includes novel agents and cyclophosphamide-containing regimens.
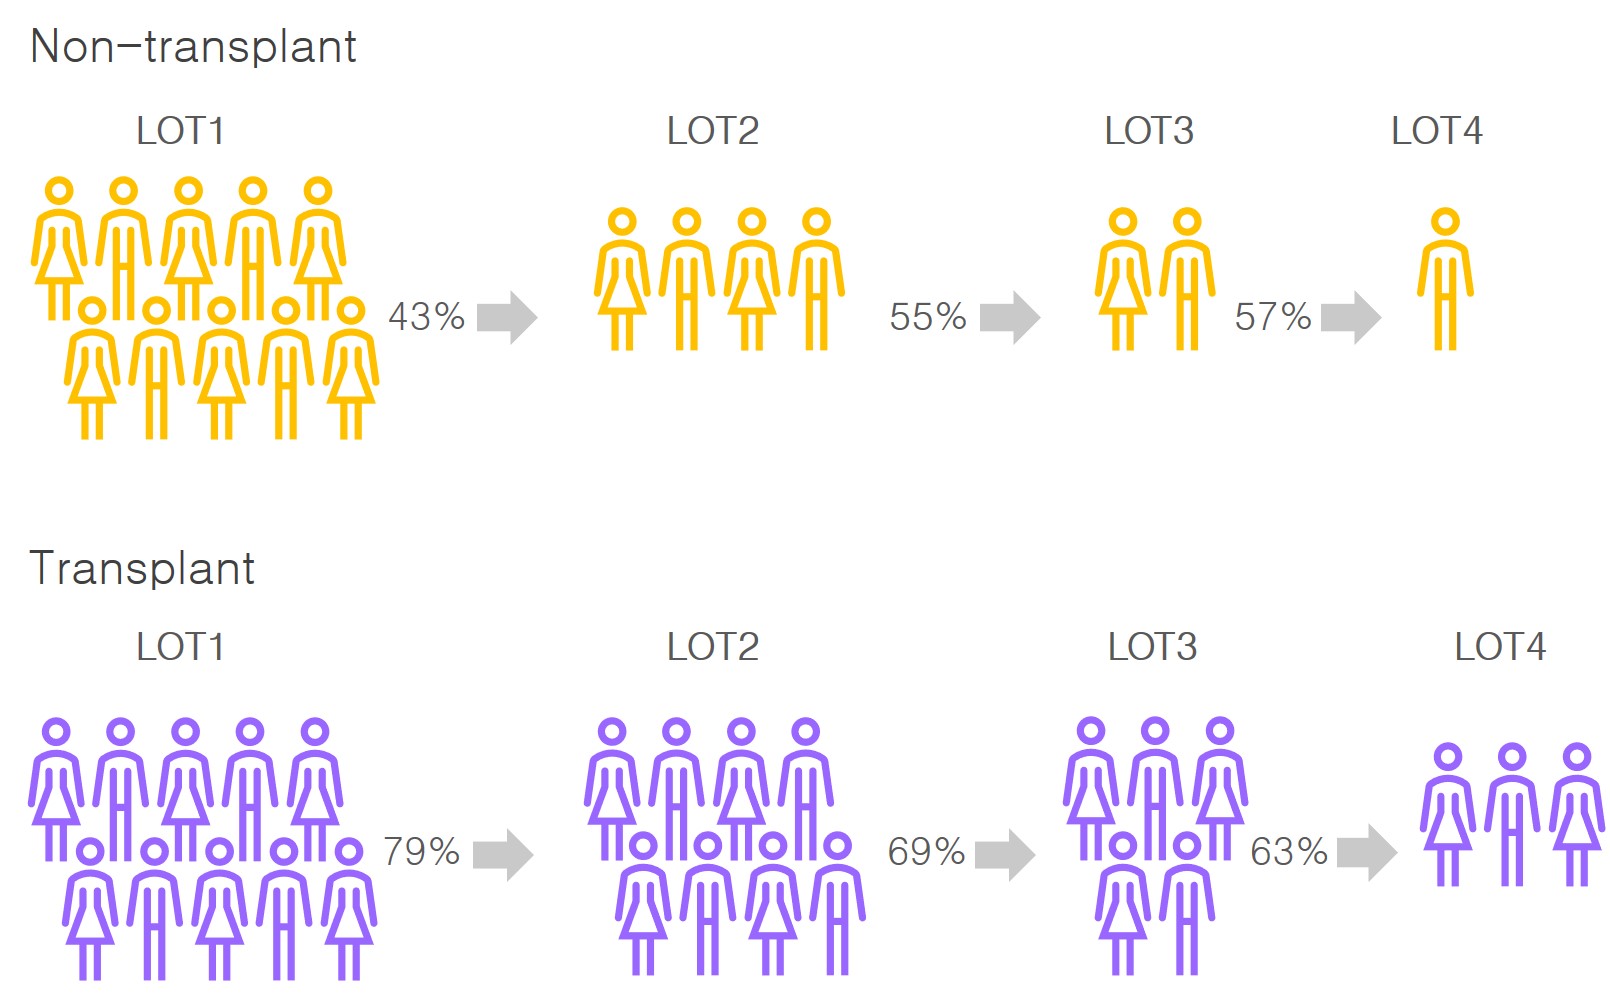
- Attrition rates were higher for non-transplant patients across all lines of therapy compared with transplant patients (range, 43–57% vs 21–37%; Table 2)
- Incidence of death was higher at each LOT for non-transplant patients compared with transplant patients (19–22% vs 3–12%), though the duration of treatment was relatively similar at approximately 6–7 months (Table 2)
Table 2. Attrition rates by line of therapy1
|
LOT, line of therapy; SD, standard deviation. |
||||||
|
LOT |
Frequency, n |
Attrition, % |
Deaths, % |
No subsequent treatment, % |
Subsequent treatment, % |
Mean treatment duration ± SD, months |
|---|---|---|---|---|---|---|
|
Non-transplant |
||||||
|
1 |
22,062 |
– |
12.9 |
44.0 |
43.1 |
6.9 ± 9.6 |
|
2 |
9505 |
56.9 |
12.2 |
33.3 |
54.5 |
7.5 ± 9.5 |
|
3 |
5182 |
45.5 |
12.3 |
30.3 |
57.3 |
6.5 ± 8.0 |
|
4 |
2971 |
42.7 |
12.3 |
30.3 |
57.4 |
5.7 ± 6.6 |
|
5 |
1706 |
42.6 |
12.3 |
29.8 |
58.0 |
5.5 ± 6.4 |
|
Transplant |
||||||
|
1 |
2763 |
– |
1.3 |
19.6 |
79.0 |
6.3 ± 8.0 |
|
2 |
2184 |
21.0 |
2.7 |
28.1 |
69.2 |
6.1 ± 9.2 |
|
3 |
1511 |
30.8 |
4.2 |
32.7 |
63.1 |
7.4 ± 9.8 |
|
4 |
954 |
36.9 |
6.3 |
28.9 |
64.8 |
6.6 ± 9.4 |
|
5 |
618 |
35.2 |
7.9 |
29.1 |
62.9 |
5.6 ± 6.2 |
- The percentage of patients that went on to receive subsequent LOT in both transplanted and non-transplanted patients is demonstrated in Figure 2
Figure 2. Transplanted and non-transplanted patients with MM that reach subsequent LOT in the US1
Conclusion
Attrition rates increase with each successive LOT for both transplanted and non-transplanted patients. Overall attrition rates are lower with transplanted patients; however, this was expected from the difference in baseline characteristics and comorbidities.
A limitation of this study was that it only included patients who had received at least one LOT and did not include all patients diagnosed with MM. Attrition rates may also have been overestimated as analysis included patients who were lost to follow-up due to a switch in insurance plans, loss of insurance coverage, or end of the study period. Furthermore, as information on disease progression was not available, it was not possible to distinguish patients who did not experience disease progression and did not receive subsequent treatment from those who had disease progression but did not receive the next treatment.
However, the overall analysis is in line with previous real-world studies. In 2016, Marc Raab, Kwee Yong, and colleagues published in the British Journal of Hematology a European study that reported the proportion of patients with MM that could receive a subsequent LOT. In this analysis, 95% of patients received ≥ 1 LOT, but rapidly decreased to 61% of patients receiving ≥ 2 LOT, and only 38% reached a third LOT.2-3 Taken together, these data suggest that the most effective treatment is needed early to provide each patient the best opportunity for durable disease control and improved survival.
References
Please indicate your level of agreement with the following statements:
The content was clear and easy to understand
The content addressed the learning objectives
The content was relevant to my practice
I will change my clinical practice as a result of this content